IN THIS LESSON
Wind: “The perceptible natural movement of the air, especially in the form of a current of air blowing from a particular direction”
What is Wind
A discussion on wind would not be complete without first understanding what wind is and how it is created. Wind (or movement of the air) occurs when there is higher pressure in one location than in another (i.e., from lower pressure to higher pressure). Weather (and wind) are changes in the bottom layer of the atmosphere. Although a broader discussion on weather is outside of the scope of this article, it bears mentioning that both temperature and pressure are effected by the sun, it’s position to the earth (i.e., angle), and its effects on the earth’s surfaces.
With that as a primer, we already understand that warm air rises and colder air falls. So then it stands to reason that when air is warmed over the equator it rises (and creates an area of lower pressure) and it the polar regions where its colder the air contracts and creates higher pressure. The last point on atmospheric pressure is that it can be plotted with isobar lines (each containing the same amount of pressure). When isobar lines are more compact, there will be greater winds and when spread out further, winds will be significantly less.
And one more tidbit. Because the Earth spins (Coriolis effect), in the northern hemisphere, wind flows clockwise with high pressure areas and counterclockwise with low pressure areas. Now that we have the big picture, let’s layer in some regional effects for wind. There are several types:
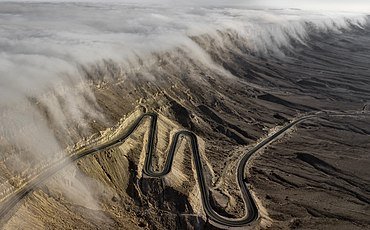
Katabatic effects - Refers to winds that carries high-density air from a higher elevation down a slope under the force of gravity (See Image 1)
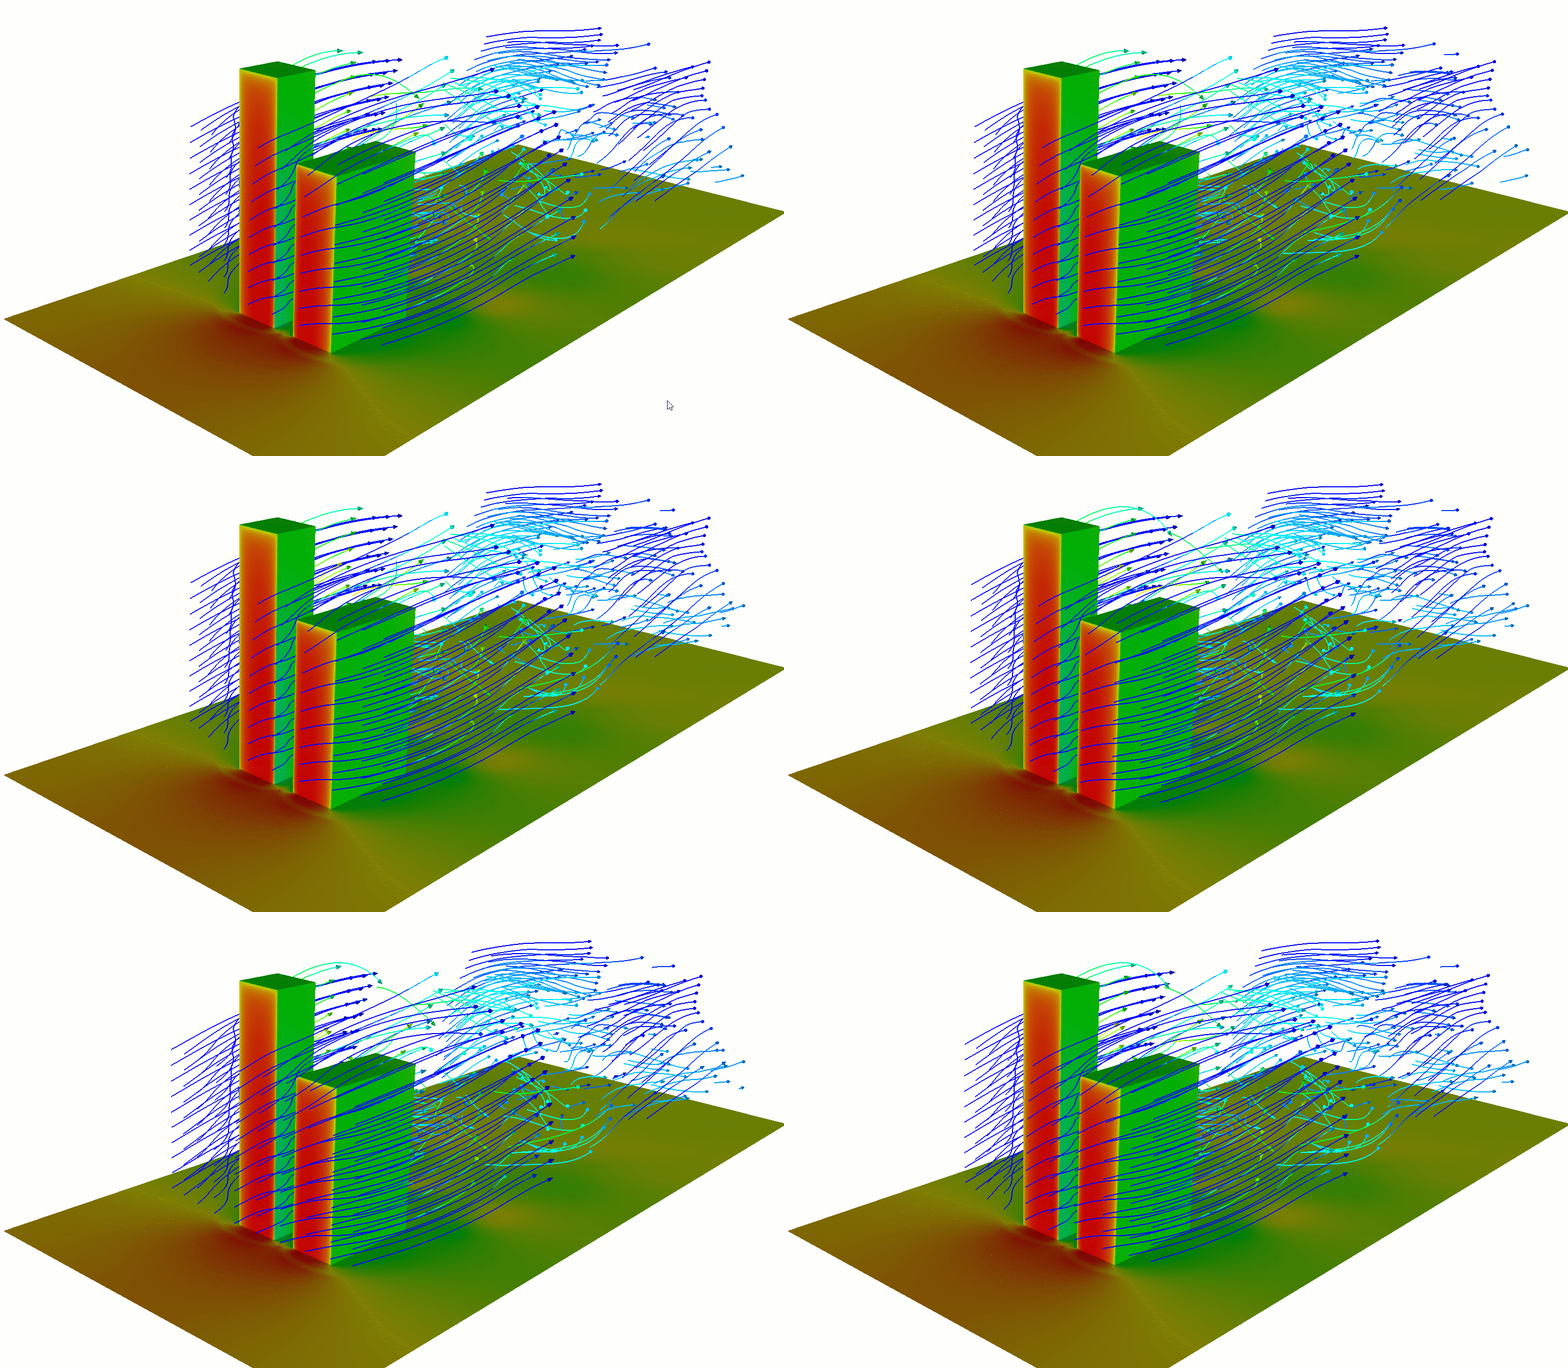
Terrain effects - Refers to wind which is affected by topographical features (e.g., skyscrapers, mountains). Wind is blocked and passes around or between those features. When directly sheltered by the feature, the wind will be significantly reduced when proximally close. However, on either side of that feature, or when directly sheltered (but just outside of the feature’s influence) the wind will be significantly increased (See Image 2) .
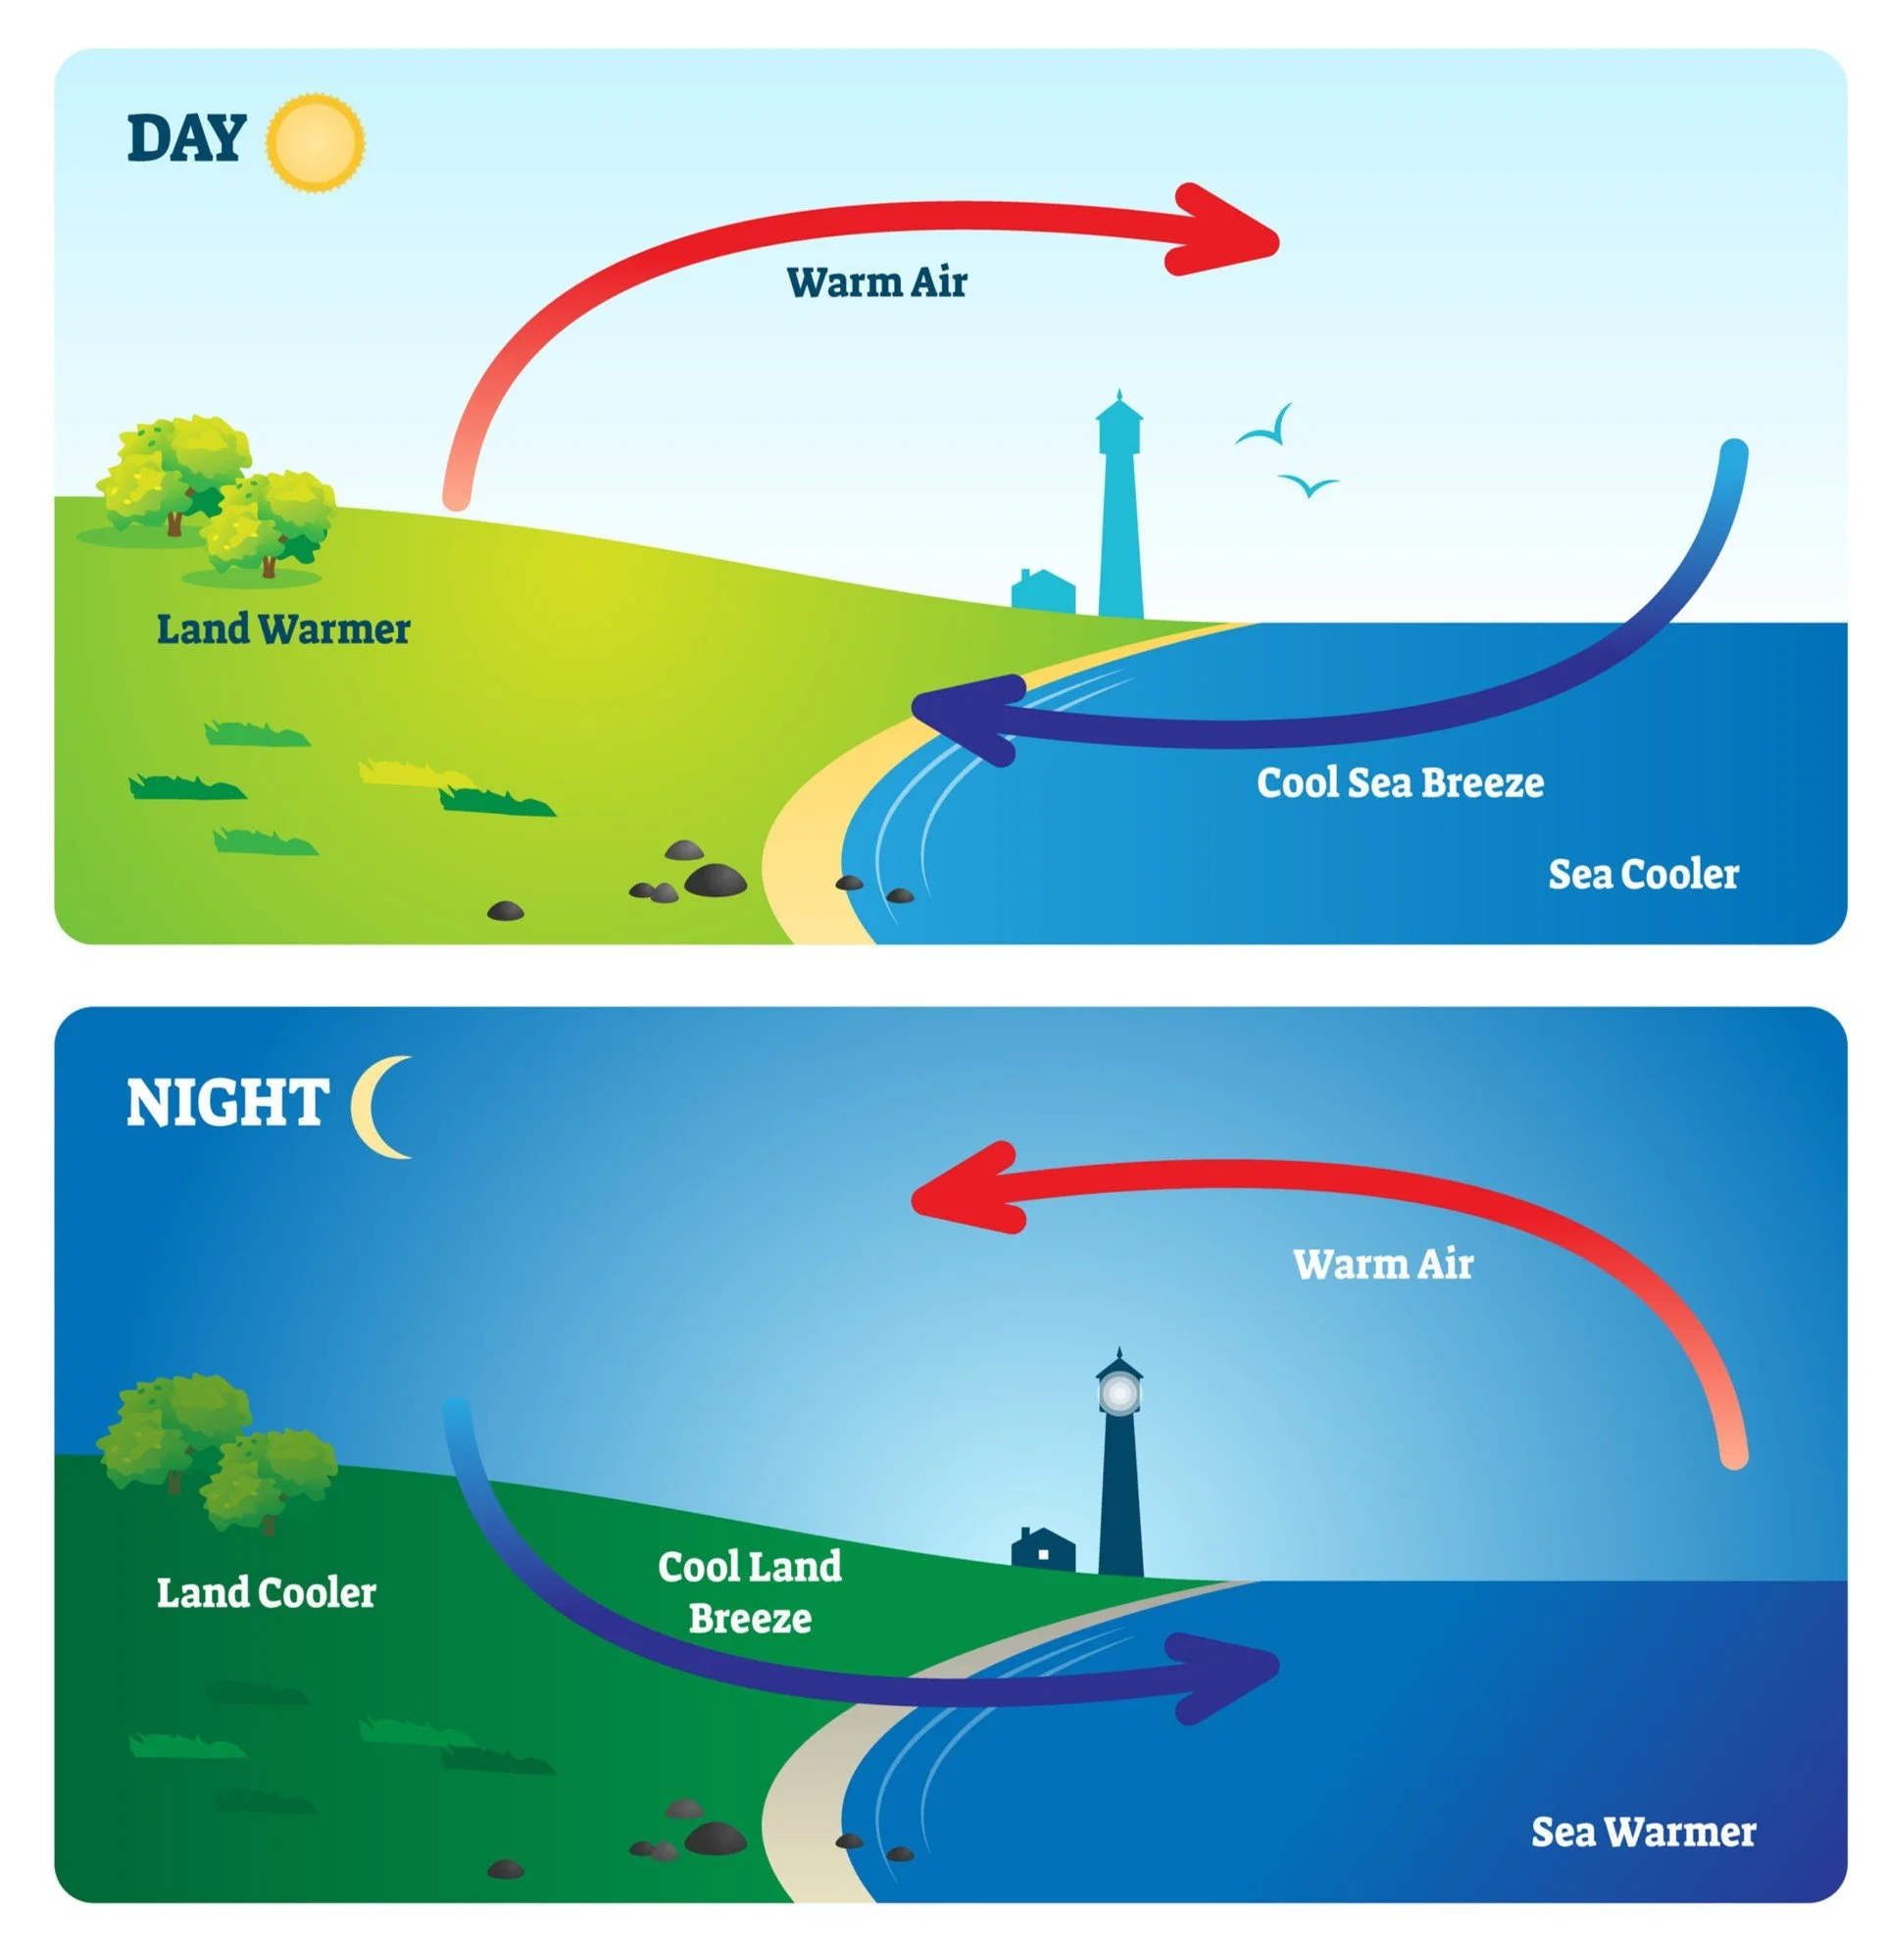
Convection effects - When air is heated (or other liquids or gases for that matter), it expands and becomes less dense. Warmer (less dense) air rises where colder (more dense) air falls and takes its place. Thus the cycle is referred to as a convection current. A good example of this are sea breezes that blow onshore or land breezes which blow offshore. Both sea breezes and land breezes are important factors in coastal navigation (See Image 3).
Image 1: Katabatic Effects
Image 2: Terrain Effects
Image 3: Convection Effects
Measuring Wind Speed
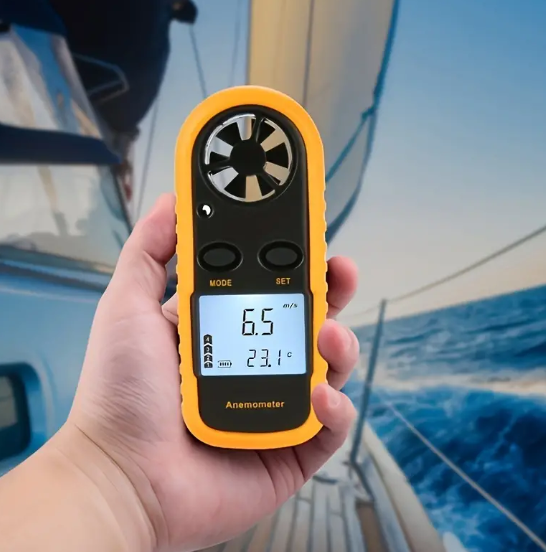
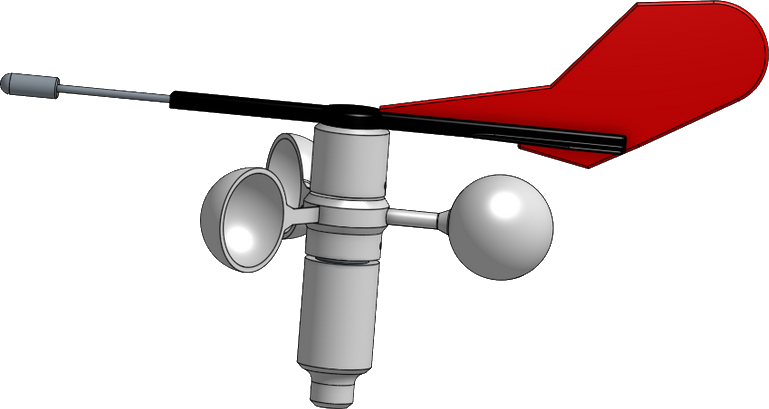
Wind speed is measured using an anemometer (See Image 4 & 5). It does this by measuring the pressure and force of the wind. There are several different types of anemometers the most common seen on sailboats are the cup anemometer and on sailors themselves are propeller anemometers.
There are others like ultrasonic, laser, and hot wire although these are outside of the scope of this article. Cup and propeller anemometers measure the wind by counting RPMs (Revolutions Per Minute) which in turn translates to feet per minute (FPM). The rotation is sensed by a magnetic or optical sensor that converts the signal to FPM measurement.
It is important to remember that the reading reflects the amount of air moving at the particular height where the anemometer is located. As an example, the windspeed can and will be significantly higher at the top of the mast versus at the height of the sailor.
Image 4: Handheld Anemometer
Image 5: Anemometer on Mast
Estimating Wind Speed (without an Anemometer)
Don’t have an Anemometer handy? Out of luck? Not necessarily as there are other ways to estimate wind speed to be fairly accurate to within a few knots (Kts) or miles per hour (MPH). We will discuss two of those ways below. They are the Beaufort Scale and Flag
Beaufort Scale
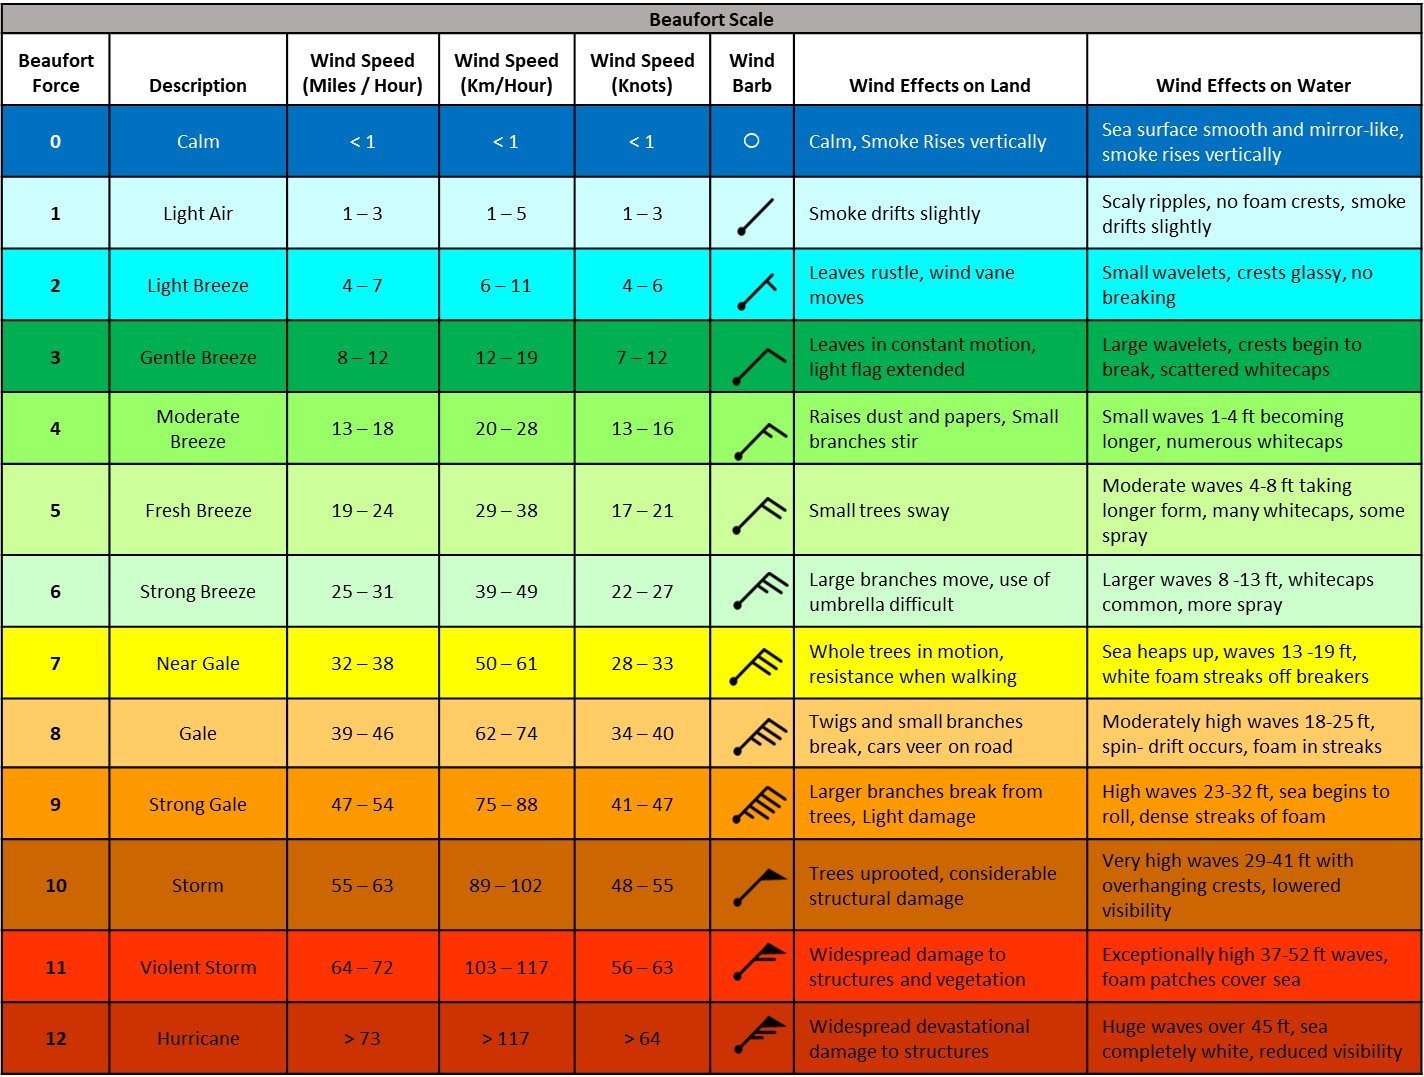
Wind speed can be estimated using a verbal scale, called the Beaufort Scale, which relates wind speed to conditions on everyday things like trees. In order to estimate windspeed, you will have to observe the effects on objects around you. It was named after Sir Francis Beaufort - an Irish hydrographer and British Royal Navy officer. The scale has been used going on 200 years as it was officially put in the service back in 1838. Since then there have been improvements (e.g., exact knots, effects on land) but since its inception has been a key tool for the mariner. Most sailors will recognize this scale as providing critical information for understanding the weather conditions while out sailing as it will have implications on sail management, strategy, and importantly navigation. It is a global standard for wind measurement as it links observed effects with wind speeds.
As you can see from the scale below, the force ranges from Force 0 (Calm) to Force 12 (Hurricane). Take a look below and you can correlate the force number to the wind speed to the effects on water or to the effects on land. This is very helpful when sailing. The helmsperson who is constantly the sea can identify the windspeed without ever having to glance down at the windspeed indicator. For instance, when seeing an occasional whitecap we can infer that the wind speed is around 12 knots. If we see many whitecaps we know the windspeed is around 15 knots.
Image 6: The Beaufort Wind Scale
Flag Shape
Wind speed can also be determined by looking at the effects on flags. Aviators have long used a wind sock to estimate speed. Ever wonder what its supposed to do? By examining its shape, one can tell what the wind speed is very quickly by just looking at it. There are two ways that flags can be used to determine wind speed. Let’s call it the easy way or the refined way.
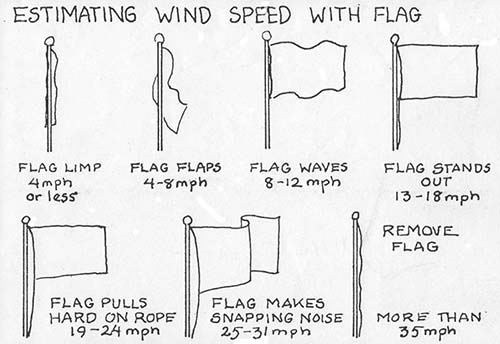
The easy way involves just looking at the flag and getting a rough idea of what the windspeed is by the shape of the flag.
If the flag is not moving, the wind is calm and below 4 mph.
If the flag moves/flaps, the wind is between 4 and 8 mph.
If the flag is waving, the wind is between 8 and 12 mph
If the flag is straight out, then wind speed is about 13 to 18 mph
If the flag is straight out and is pulling hard on the halyard, then wind is about 19-24 mph
If the flag is straight out and making a flapping noise, wind is between 25 and 31 mph
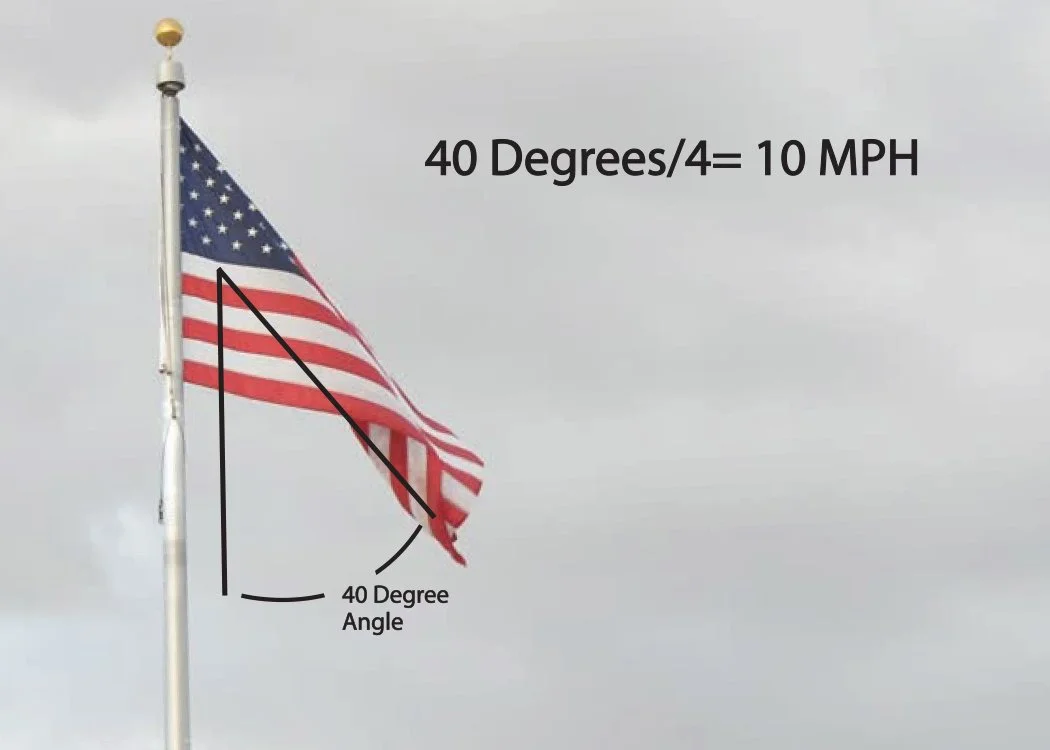
The refined way involves doing a little math. and requires a little bit of geometry (don’t worry no need to crack a textbook). By using the flag pole as one side (or the base), estimate the angle of the flag in relation to the flagpole. Once you estimate what that degree is, then divide it by four. And there you have it. The answer is the approximate wind speed in miles per hour.
Some examples:
Flag is completely lying completely down and parallel to the flag pole. If this is the case, then the angle would be 0° so the equation would be 0° / 4 = 0 mph
Using figure 8, the angle is estimated at 40°. Going back to the equation then 40° / 4 = 10 mph.
If the flag is straight out and pulling hard at 90°, then it would be 90° / 4 = 22.5 mph or ~ 20 mph
And there you have it, two ways to estimate wind speed using a flag. Again, not as exact as measuring FPM of wind flowing being measured by an optical or magnetic sensor of an anemometer, but good enough in a pinch or to impress your friends at bar-b-que.
Figure 7: Estimating wind speed based off flag shape
https://www.deepwaterhappy.com/2020/09/07/measuring-wind-speed/
Figure 8: Estimating wind speed based off angle of flag

